McIntosh Reverberant Room
A History
Copyright 1996-2005 by Roger Russell
All rights reserved
No portion of this site may be reproduced in whole or in part
without written permission of the author.
![]()
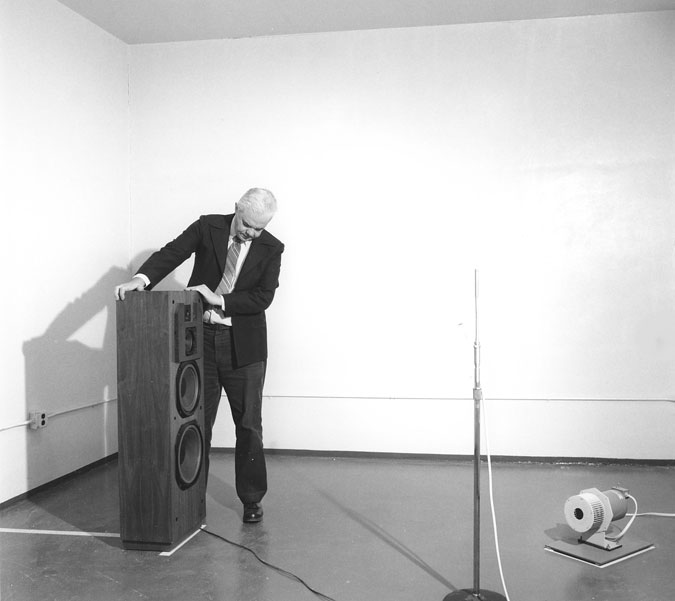
Here I am in the plant 4 in one of two reverberant rooms positioning an XR1052 at the painted line. Although the location of the speaker in the room is not critical, I always want the tests to be as repeatable as possible.
The purpose of a reverberant room is to sum up the total energy that a speaker radiates regardless of its directional properties. This is related to acoustic power. A speaker that does not have a smooth response in the reverberant room will probably not sound good in the listening room. This is despite the fact that it might measure flat on axis in the anechoic chamber. The reason is that measurements at only a few points in the anechoic chamber are not sufficient to adequately sum up the total radiated power.
All surfaces of the room had a very low absorption coefficient. The walls, ceiling and floor were made entirely of concrete, coated with hard plaster and then painted with epoxy paint to be as reflective as possible. The dimensions of 16' by 13' and a 10' high ceiling were proportioned to give useful measurement down to 250 Hz and could be calibrated as low as 80Hz. The tall stand holds the B&K 4134 random incidence microphone, which faces upwards.
At the right on the floor is the ILG sound source calibration fan. Although it's nothing more than a squirrel cage fan on a motor shaft, this particular fan produces a very flat sound power spectrum from about 80Hz to 10kHz. The fan generates one acoustic milliwatt of power. The acoustic consultants Bolk, Beranek and Newman recommended it. A rubber pad under the plate holding the fan kept it from moving around on the floor when it was running.
One acoustic milliwatt of broadband noise in the reverberant room is too loud to talk over. It leads to the question of loudspeaker efficiency. If one acoustic milliwatt is so loud, then how come we need so much power to drive speakers? The answer is a theorem for maximum power transmission. Matched impedances give maximum power transfer. The speaker cone is a high impedance source. Try sticking your finger through it. The air, on the other hand is very low impedance. It's easy to put your finger through it. Energy transfer, therefore, is very inefficient and we need comparatively high power to the speaker to get the same level as the fan.
Speaker measurements in the room were made by feeding a pink noise signal into the speaker being tested. The output from the microphone was fed to a General Radio 1/3 octave sound and vibration analyzer and the response curve was automatically plotted. A calibration curve was also made on the same graph. This was done by making a response curve of the fan. The speaker to be measured was always left in the room for the calibration curve. The absorption caused by the presence of the speaker in the room was enough to produce minor changes in the measured response of the fan.
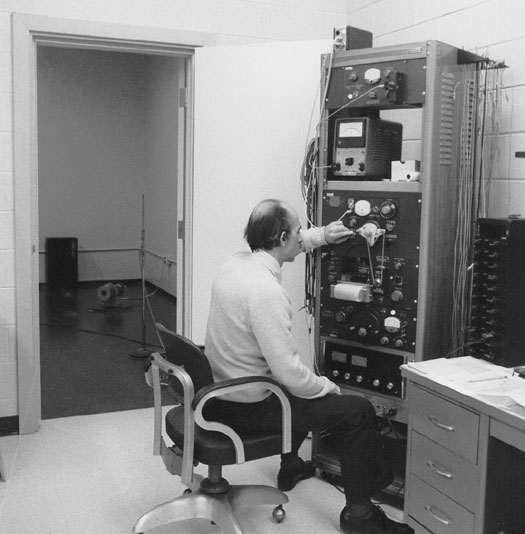
Mike Spencer, who was in charge of customer service, had stopped by to check the performance of a customer’s speaker. This test setup is for reverberant room #2. An MC2105 was used to drive the speakers. The black box at the right holds individual crossover networks for each of the drivers used in the McIntosh speaker systems.
The reason for running a calibration curve each time was that the temperature and humidity in the room were constantly changing. The air in the room was effectively part of the test equipment. The humidity was an important factor in controlling the amount of absorption in the air. The extremes were from summer to winter where measurements in the room at mid and high frequencies varied as much as 5dB. Oddly enough, there were more highs (less absorption) with higher humidity than with low humidity, down to about 15%, then the curve reversed. The humidifier system in the lab helped in the winter, but we could not run it too high. Too much moisture at 10 below zero outside caused water to run on the windows and even some of the walls
Before we had the fan, time consuming calibrations had to be done frequently. The decay curve had to be plotted with the General Radio Graphic Level Recorder running at high speed. The slope of the 60dB decay curve was found for each of the thirty one 1/3 octave bands and the decay time determined knowing the chart speed. The sound power could then be calculated for each frequency and a calibration curve could then be made. At 250Hz, the decay time was 7.2 seconds. This was sufficient to give good response averaging. The decay time decreased as frequency increased.
We even made a spectral analysis of several musical instruments in the reverberant room using the peak hold feature of the B&K real time analyzer. This revealed the approximate total energy of the instrument regardless of its directional properties. A cymbal crash in the all-reflecting environment was a little suicidal, as it was very loud for the person doing it. At 1 meter the cymbals could peak at over 120dB.
![]()
|
About This Site |
||
|
|
More text and pictures about McIntosh will be added as my research continues. Any comments, corrections, or additions are welcome. |
|
|
|
Created
by Roger Russell |
|