Welcome to Roger Russell's
McIntosh Equalizer History Part 2
Room
Resonances and Room Construction
and an Experimental Update for the MQ101
These pages are copyrighted.
No portion of this site may be reproduced in whole or in part
without written permission of the author
![]()
Although the ML-1C and MQ101/MQ102 system design described in my patent can provide flat response within 1 dB down to 20 Hz and can compensate for radiation into different solid angles, it cannot compensate for room resonances. These resonances create acoustic standing waves in the listening environment. They are caused by sound reflected back and forth from opposite walls or between floor and ceiling. They can seriously alter this nice smooth response created by the speaker and equalizer.
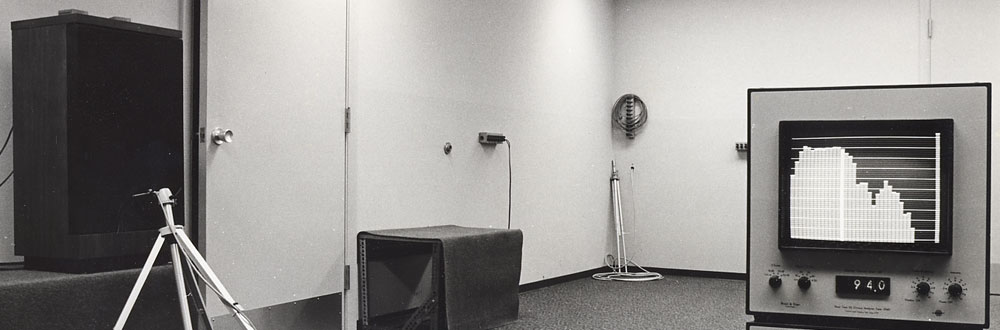
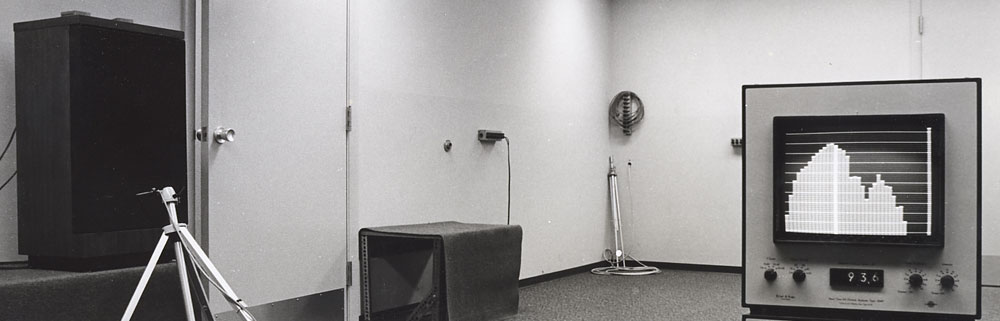
I took a series of pictures to demonstrate the effect of the room acoustics on the McIntosh XR5 loudspeaker/equalizer combination. Pink noise is fed to the MQ101 equalizer that is set to position 5 for flat response. The output is connected to a power amplifier and then to the XR5. A Bruel & Kjaer 3347 1/3 octave real time analyzer (RTA) displays the 4133 microphone output. Frequency bands are displayed as 40 separate columns covering a wider than normal hearing range from 12.5Hz to 40kHz. The microphone is mounted on a tripod.
Conditions for the first four pictures are the same except for the microphone position. The 250Hz band is highlighted on the monitor screen and is the crossover frequency for the woofer. The vertical display range is 50dB. Each major horizontal line is 5dB. The last two frequency columns on the left side of the screen are 12-1/2Hz and 16Hz. Response below 20Hz is deliberately rolled off by the MQ101 equalizer. As the microphone is moved further back, the level on the screen will be correspondingly lower.
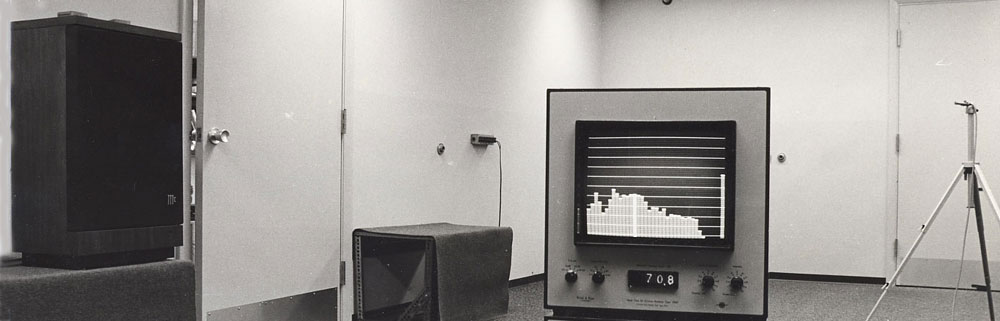
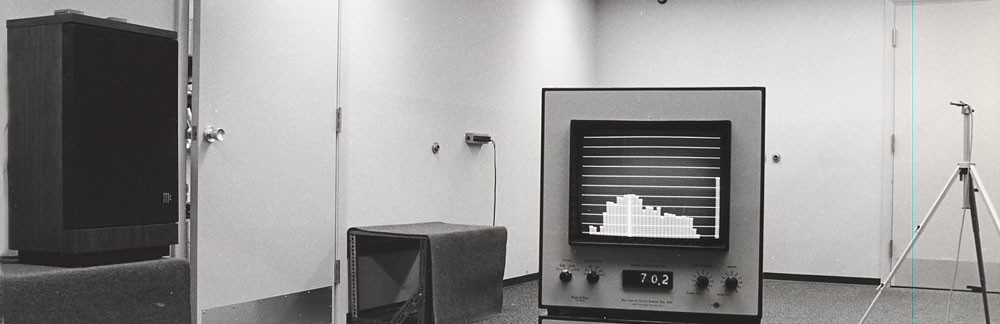
With the microphone about two inches from the woofer,
the response is within one dB from 20Hz to 250Hz.
Output is mainly from the woofer because the microphone is closest to it.
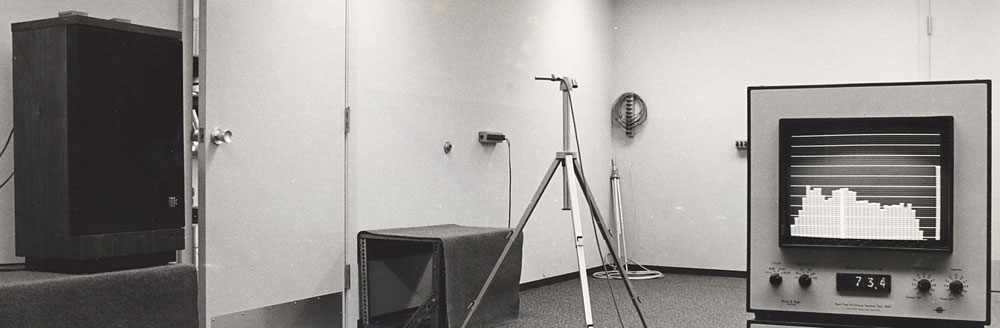
With
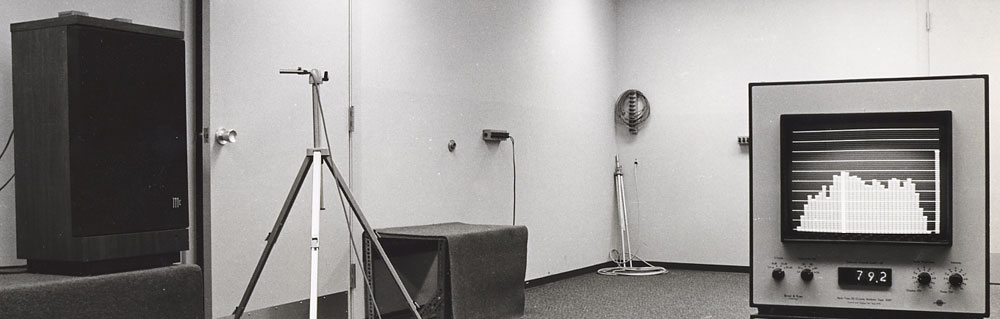
the microphone at a distance of 16 inches and at the tweeter height,the low
frequency response continues to be very smooth
except for the appearance of a hole at 100Hz and a slight
rise at 250/315Hz.Now we are beginning to see the influence
of the room environment on response. The last three columns shown in the
right portion of the display are
31.5kHz, 40kHz and the input reference to the RTA.display.
With a microphone distance of 50 inches, low frequency
response becomes more uneven as the room resonances become more dominant.
A peak is centered at 40/50Hz and increases at 250/315Hz. The dip in
between is at 100Hz.
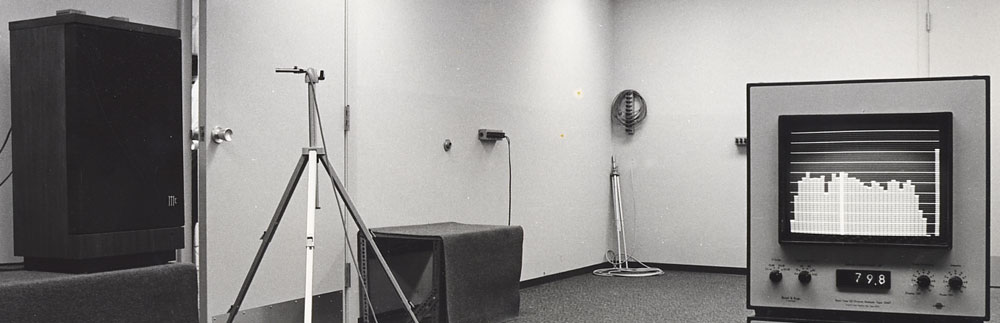
With the microphone at 127 inches, the dominant low frequency response is exagerated by the room resonances.
Room dimensions and resonant frequencies are indicated in the following chart:
|
Room dimension |
Full wavelength |
1/2 wavelength |
1/4 wavelength |
|
25
feet |
45.2Hz |
90.4Hz |
180.8 |
There is good correlation between the dimensions and the measured resonances at full and half wavelengths for the 40/50Hz, 100Hz and 250/315Hz bands. Each resonant frequency is very narrow and is contained within the corresponding 1/3 octave band of the analyzer. Some are reinforcements and some are cancellations.
![]()
What if the equalizer is not used?
The same room resonances occur and the effect on the response is the same. However, without equalization, the response from the speaker is no longer flat for the close microphone measurement. When I took the first set of pictures, I also took a second shot at each distance with the equalizer set to the flat position 1 so the microphone position is exactly the same. The RTA display varies by a dB or so for each picture as it is constantly averaging each frequency band. The RTA circuitry keeps the time-bandwidth product constant for each frequency.
The response rolls off at 150Hz without the equalizer. Again, the output shows mainly for the woofer because the microphone is closest to it.
At 16
inches, the mid and highs begin to showas before.
Room resonances actually help to fill in the 40/50Hz area, but the 230/315Hz area has increased too much.
The dip at 100Hz can also be seen.

At 50 inches, room resonances at 230/315Hz reinforce even more. The previous peak at 40/50Hz matches the mid response.
With
the microphone at 127 inches, the dominant low frequency response is almost
completely controlled by room resonances.
Resonances in the 230/315Hz area remain but the deep
bass is lost
At even more microphone locations around the speaker and further into the far field, the response will be different depending on the standing wave pattern for each frequency. Despite the effect of the room, the low frequency response with the equalizer is superior. However, both conditions with or without the equalizer could be made better, but how?
All speakers are influenced to some degree by the listening environment. They range from moderate to extreme. A room with equal dimensions, stone, glass or brick walls, a bare floor of concrete, tile or hardwood and a ceiling of hard plaster is a speaker system's worst nightmare---and then the customers complain about the sound of the speakers!
Dimensions
Room dimensions have a big influence on the low frequency sound mainly below 250 Hz but can extend up as high as 1000 Hz. Problem rooms can have equal or near equal dimensions. They can also have multiple or near multiple dimensions. This will produce strong resonances and produce support for only a few low frequencies or a group of closely spaced frequencies. For example: A room that is 22-1/2' wide by 15' deep by 7-1/2' high has multiples of 7.5 in each dimension. This can cause resonances at 150, 300 and 600 Hz in each direction. There will be little support for the frequencies in between. Peaks and dips of up to 15dB can be found, usually below 250Hz.
In designing a room with good dimensions, it's best to have non-equal or non-multiple dimensions. This will spread out the resonances more evenly throughout the low frequency spectrum without exaggerating only a few. A ratio of 1 to 1.25 to 1.6 is very acceptable. For the home this can be adjusted to a multiple such as 1 to 2.5 to 3.2. This ratio translates to a room having a ceiling height of 7-1/2'. The width and depth come out to be 18-3/4' by 24'. Angled ceilings or walls will also help to spread resonances out.
Walls
There is more than just dimensions to consider when making a good listening room. Our listening room at the lab has concrete block walls. When resonances occur in this room, even though they are distributed better, they have very high amplitude. This is because the walls don't absorb much of the sound striking them.
The solution to this is to add wall construction similar to that found in typical homes. This consists of 2X4's spaced away from the wall by an inch or so and fastened only at the floor and ceiling. The wide side of the 2X4 can be facing towards the room to keep lost space to a minimum. The distance between 2X4's can be the standard 16" and fiberglass insulation can be added between them. Sheet rock or blue board can be used as the wall surface. This has a high mass and will move at low frequencies to absorb some of the energy and reduce the resonant peaks.
Surfaces
There is still more to be done before the room is finished. Although the room dimensions and wall construction may be adjusted to be good at low frequencies, there are still reflections at the mid and high frequencies. Some people reject the handclap test as being ineffective but Mr. McIntosh always used this simple test to determine the characteristics of a room. It works. If you can hear echoes after a handclap, you need acoustic treatment on the walls, ceiling or floor. One of two parallel walls should have absorbing material. For square or rectangular rooms, this means two adjacent walls should have heavy drapes or other absorbent material.
There's also floor to ceiling reflections to consider. In many cases the carpet and/or underlayment on the floor does not absorb enough sound. This was the case in our listening room. The addition of an acoustic tile ceiling solved the problem and the handclap test was then successful.
The Real World
Although this information may be helpful to those who are planning a new room or a new house, most of us are resigned to an existing room where dimensions or construction cannot be easily changed. The surfaces are about all that can be adjusted.
 This equalizer was our first step to compensate for
room resonances and at the same time provide the required low frequency
equalization for the speakers. After the MQ101 and MQ102 had been in use for a
while, I made measurements in various homes and dealer stores to gather more information
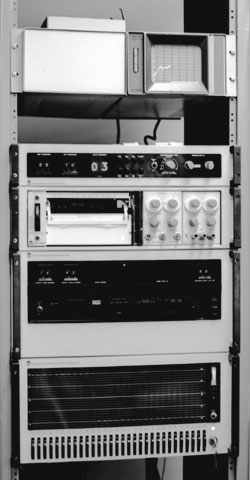
about typical rooms where the speakers were being used. We had purchased a
General Radio 1925 Multifilter that is the basis for a real time analyzer. It
has 1/3 octave class III filters, which means the filters roll off very rapidly
on either side of each 1/3 octave pass band. By playing pink noise through the
speaker system, the noise is picked up by a microphone at the listening
position and sent to the analyzer. The resulting response is then automatically
plotted on graph paper. Several different microphone positions were required to
obtain useful results. It might be noted that some measurements were made
driving both speakers at the same time. In this case, both speakers would be in
phase with an identical signal and could interfere with each other causing
peaks and dips in the apparent response. In this case, I used a second pink
noise generator so that the two channels were randomly phased and a proper
measurement could be made.
This equalizer was our first step to compensate for
room resonances and at the same time provide the required low frequency
equalization for the speakers. After the MQ101 and MQ102 had been in use for a
while, I made measurements in various homes and dealer stores to gather more information
about typical rooms where the speakers were being used. We had purchased a
General Radio 1925 Multifilter that is the basis for a real time analyzer. It
has 1/3 octave class III filters, which means the filters roll off very rapidly
on either side of each 1/3 octave pass band. By playing pink noise through the
speaker system, the noise is picked up by a microphone at the listening
position and sent to the analyzer. The resulting response is then automatically
plotted on graph paper. Several different microphone positions were required to
obtain useful results. It might be noted that some measurements were made
driving both speakers at the same time. In this case, both speakers would be in
phase with an identical signal and could interfere with each other causing
peaks and dips in the apparent response. In this case, I used a second pink
noise generator so that the two channels were randomly phased and a proper
measurement could be made.
To speed up the time required to accomplish all of these measurements, we also purchased a General Radio 1566 Multichannel Amplifier and six 4134 Bruel & Kjaer condenser microphones. I selected this type of microphone because most of the measurements were to be made in the far field of the rooms, which is more of a diffuse field than direct radiation from the speakers. Each microphone cartridge was attached to a General, Radio 1560-P42 preamplifier that provided the 200V polarizing voltage and each had a switch to provide 10 dB of extra gain, if needed. Multiple microphones enabled us to measure at six different microphone locations in the room at the same time, including different heights. Each microphone output was automatically sampled from 20Hz to 20kHz and the combined output of all the microphones averaged into a single curve that was plotted on the chart paper. Of course, each microphone has a slightly different sensitivity and a Bruel & Kjaer acoustic calibrator, also known as a Pistonphone, was used on each microphone. Individual input level controls on the 1566 Multichannel Amplifier could be adjusted to produce the same amplitude on the graph paper from each microphone.
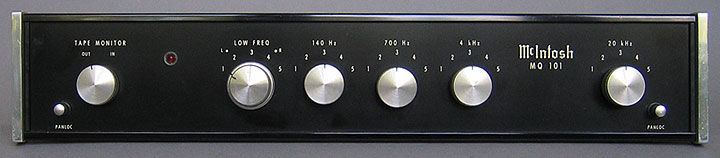
After assembling the data from all of these room measurements, I could see a general trend of the room influence on sound. Gordon Gow had a few experimental equalizers made for dealers to evaluate. This could allow them to correct for some of the common room problems. In addition to the basic low frequency compensation of the MQ101, I selected frequencies of 140Hz, 700Hz, 4kHz and 20kHz. The 20k band is the same as the 20kHz band in the MQ101 and extends down to 2kHz. The equalizer is constructed using an MQ101 chassis. Because this was only an experimental equalizer, the time and expense needed to create an illuminated front panel was not justified. A silk screened aluminum panel was used instead. This equalizer has the same knob style as the C26 preamplifier. The red power indicator is a light emitting diode. The indicator was originally an incandescent lamp, the same lamp that was to be used in the ML-D series of speakers that never went into production.
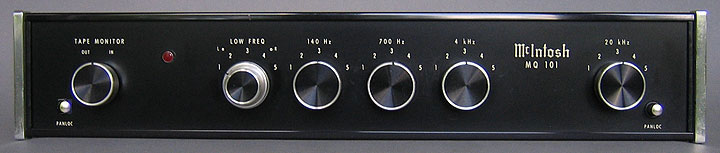
A second equalizer has been found that was modified, perhaps by a previous owner. The original MQ101 knobs have been replaced with newer style knobs like those used in the C27 preamplifier. The 4kHz circuitry has been bypassed and the tape monitor switch connections have been reversed. However, the power indicator light is original. Internally, both equalizers originally had the same construction and both will fit in the standard MQ101 cabinet using the Panloc feature.
The response of the equalizer is flat with the switches set as follows: low frequency at 1, 140 Hz at 5, 700 Hz at 3, 4 kHz at 3 and 20 kHz at 3. The contours for the low frequency switch are described in the MQ101 section. The 140 Hz switch cuts response in 2 dB steps. The 700 Hz switch boosts and cuts in 2-1/2 dB steps. The 4 kHz switch boosts and cuts in 2-1/2 dB steps and the 20 kHz switch boosts and cuts in 2 dB steps at 20 kHz. The 140 Hz band was designed to be cut only because this frequency area needed the most correction.
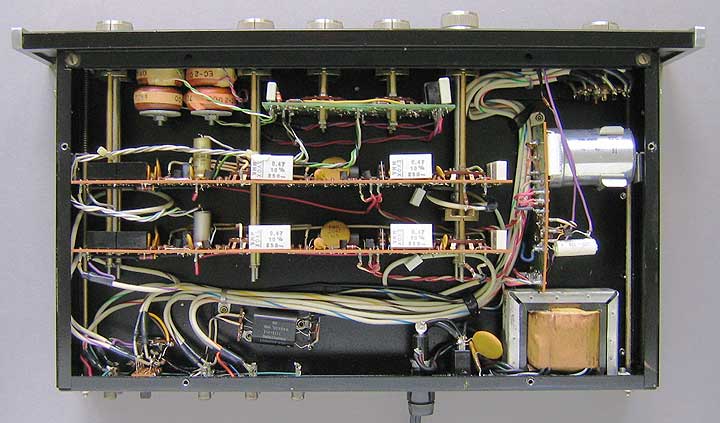
A printed circuit board was added to the original MQ101 near the center front that contains the 140Hz and 700 Hz switches and some of the associated circuitry. Four toroidal coils were added near the front as well.
Although the updated equalizer did help moderately in some rooms, it became obvious that it was far from effective in fixing the real problem rooms. Something more sophisticated was definitely needed. A narrower bandwidth and more frequency adjustments would be much more useful. Only a few of these equalizers were made and it never went into production. No manual was issued. See part 3 for the next step in McIntosh equalizers.
|
Part 1 The ML-1C Speaker, MQ101 and MQ102 Equalizes Part 2 Room Resonances and Room Construction Part 3 The MQ104 equalizer, AA2 Analyzer and CM201 microphone Part 4 The MQ107, MQ108, MQ109 and the XRT26 speaker System |
![]()
|
About This Site |
||
|
|
More text and pictures about McIntosh will be added as my research continues. Any comments, corrections, or additions are welcome. |
|
|
|
All
contents are copyright |
|